A sequential Bayesian model for
learning and memory in
multi-context environments
Dave F. Kleinchmidt
Rutgers University/Princeton Neuroscience Institute
Pernille Hemmer
Rutgers University
24 July 2018 // MathPsych // osf.io/dqz73
in the real world judgements are made in
context
which provides useful information
In [2]:
arena()
Out[2]:
In [3]:
x, y = -0.3, 0.4
arena([x], [y], color="black")
Out[3]:
In [5]:
plot(Gray.(rand(Bool, 100,100)), axis=false, lims=(0,100), aspect_ratio=:equal)
Out[5]:
In [6]:
arena([x], [y], color=:white, markerstrokecolor=:black, markersize=5)
annotate!(0,0, text("?", 32))
Out[6]:
In [7]:
arena(randn(200).*0.2, randn(200).*0.2, color=:black, markeralpha=0.25)
scatter!([x], [y], color=:white, markerstrokecolor=:black, markersize=5)
Out[7]:
In [8]:
quiver!([x], [y], quiver=(-[x*0.3], -[y.*0.3]), color=:black)
Out[8]:
In [9]:
srand(2)
θ = rand(200) * 2π
ρ = randn(200) * .05 + 0.85

arena(cos.(θ).*ρ, sin.(θ).*ρ, markeralpha=0.25, color=:black)
scatter!([x], [y], color=:white, markerstrokecolor=:black, markersize=5)


quiver!([x], [y], quiver=([x*.3], [y*.3]), color=:black)
Out[9]:
but what is a
context?
and how do you know?
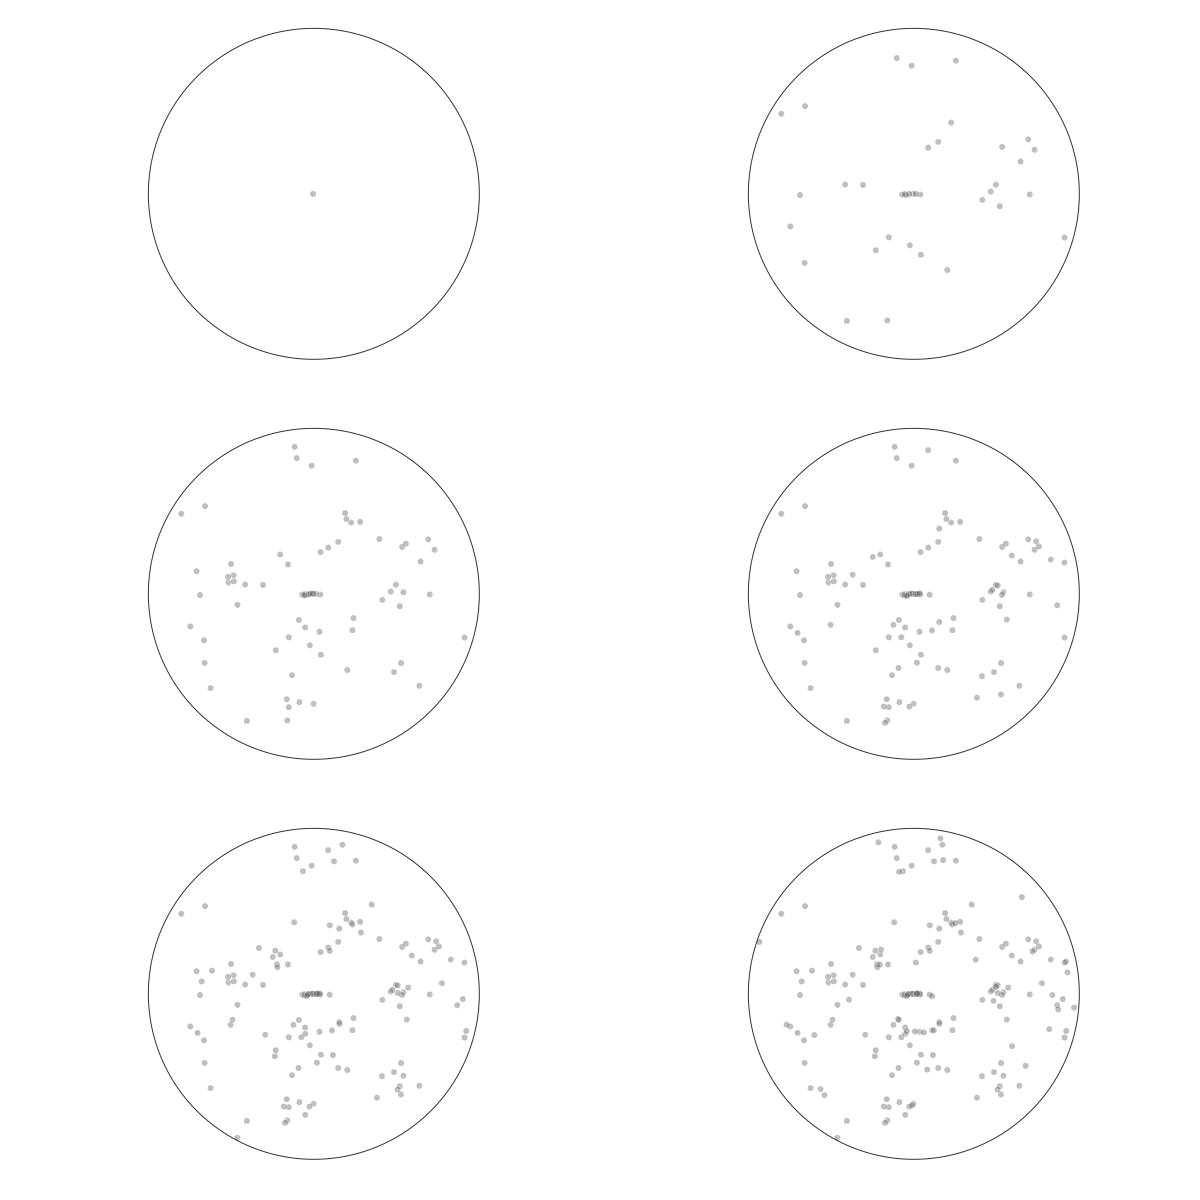
history provides context
In [50]:
r1_shuffled = view(recall, randperm(180) .+ 20, :)

p = arena([], [], markeralpha=0.25, color=:black, lims=(-1.1,1.1))
anim = @animate for (x,y) in @_ zip(r1_shuffled[:x], r1_shuffled[:y])
    push!(p, x,y)
end

gif(anim, "figures/shuffled.gif", fps=5)
INFO: Saved animation to /home/dave/.dropbox-raizadalab/Dropbox (Raizada Lab)/work/dots-location-memory-pernille/figures/shuffled.gif
Out[50]:

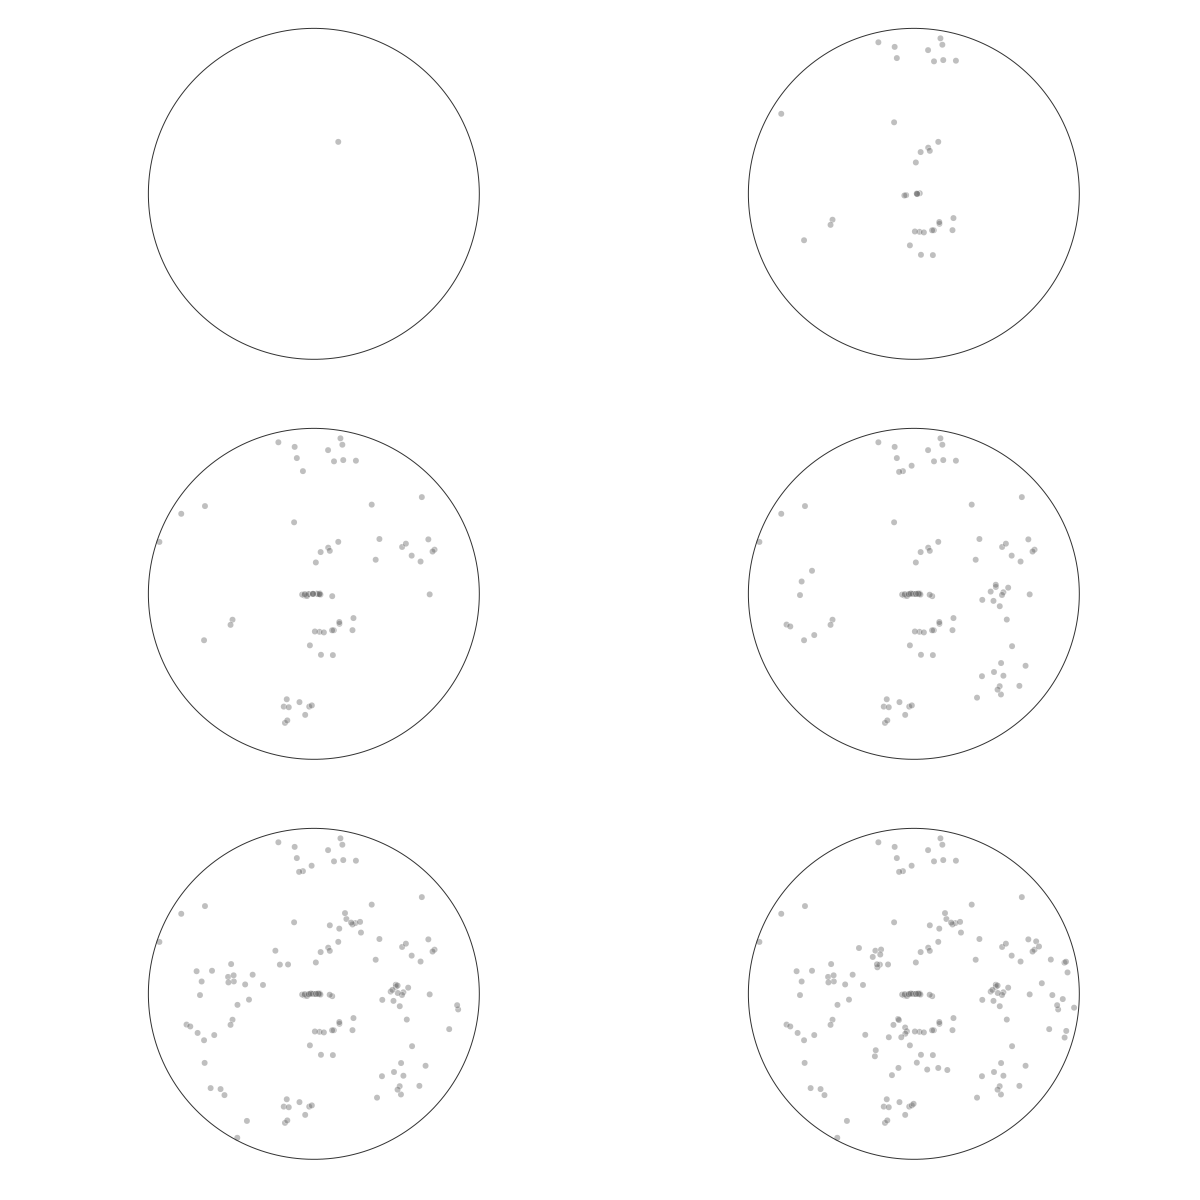
history provides context
In [49]:
p = arena([], [], markeralpha=0.25, color=:black, lims=(-1.1,1.1))
anim = @animate for (x,y) in @_ zip(recall[:x], recall[:y]) |> It.drop(_, 20) |> It.take(_, 180)
    push!(p, x,y)
end

gif(anim, "figures/clustered.gif", fps=5)
INFO: Saved animation to /home/dave/.dropbox-raizadalab/Dropbox (Raizada Lab)/work/dots-location-memory-pernille/figures/clustered.gif
Out[49]:

Behavior
In a structured environment recall is biased towards clusters [Robbins, Hemmer, and Tang, CogSci2014]
In [14]:
arena(lims=(-1,1))
@_ known_recalled1 |>
    @by(_, :block, x_clus = mean(:x), y_clus = mean(:y)) |>
    @df(_, scatter!(:x_clus, :y_clus, color=:red, seriestype=:scatter, markerstrokecolor=:white))
@df recall1 quiver!(:x, :y, quiver=(:x_resp.-:x, :y_resp.-:y), color=:black, seriestype=:quiver, lims=(-1,1))
Out[14]:
Behavior + cluster bias
In a structured environment recall is biased towards clusters [Robbins, Hemmer, and Tang, CogSci2014]
In [16]:
arena(lims=(-1,1))
@_ known_recalled1 |>
    @by(_, :block, x_clus = mean(:x), y_clus = mean(:y)) |>
    @df(_, scatter!(:x_clus, :y_clus, color=:red, seriestype=:scatter, markerstrokecolor=:white))
@df known_recalled1 quiver!(:x, :y, quiver=(:x_resp.-:x, :y_resp.-:y), color=GrayA(0.0, 0.5))
@df known_recalled1 quiver!(:x, :y, quiver=(:x_mod.-:x, :y_mod.-:y), color=RGBA(1, 0, 0, 0.5))
Out[16]:
approach: bounded rationality
Computational-level: Dirichlet Process mixture model
- Infer how points $x_t$ are assigned $z_t$
- $p(z_1, \ldots, z_T | x_1, \ldots, x_T) \propto p(x_1, \ldots, x_T | z_1, \ldots, z_T) p(z_1, \ldots, z_T)$
- Prior: "sticky" CRP $p(z_t = j | z_{1\ldots t-1}) \propto N_j (\times \frac{\rho}{1-\rho}$ if $z_{t-1}=j)$
- $N_j = \alpha$ for all new $j$.
- Prefer small number of contexts
- Allow for up to $T$ (one per point)
- Likelihood: $p(x_t | z_t, z_{1:t-1}, x_{1:t-1}) = p(x_t | \{x_i \ \mathrm{if}\ z_i = z_t\})$
- Prefer compact clusters
Algorithmic-level
approach: bounded rationality
Computational-level
Algorithmic-level: Sequential Monte Carlo
- online (not batch)
- finite uncertainty
- particle filter:
- Each particle is one hypothetical clustering $z_{1\ldots t}$
- Update particles in parallel following new data point
- Re-sample when particles become too homogenous
Learning clusters
In [51]:
@df recalled1 plot(arena(:x, :y, group=assignments(first(particles(rf))), title="Inferred clusters"),
                   arena(:x, :y, group=:block, title="True blocks"),
                   layout=(1,2), size=(800, 400))
Out[51]:
Learning clusters
In [52]:
plot(plot(show_assignment_similarity(rf), title="Inferred clusters"),
     plot(Gray.(@with(recall1, :block .== :block')), title="True blocks"),
     axis=false, aspect_ratio=:equal, layout=(1,2), size=(800,400))
Out[52]:
Recall: model
In [28]:
size2 = (900,400)

p1 = @df recalled1 arena(:x, :y, quiver=(:x_mod.-:x, :y_mod.-:y), seriestype=:quiver, label="Model",
                         layout=@layout([a{0.5w} _]), size=size2)
Out[28]:
Recall: model + behavior
In [29]:
@df recalled1 quiver!(:x, :y, quiver=(:x_resp.-:x, :y_mod.-:y), color=GrayA(0.0, 0.3), label="Behavior", subplot=1)
Out[29]:
Recall: model + behavior
In [30]:
@_ baseline_good |>
    @where(_, :subjid1 .== 7) |>
    @df _ begin
        plot(arena(:x, :y, quiver=(:x_mod.-:x, :y_mod.-:y), seriestype=:quiver),
             histogram(:cos_mod, bins=20, normalized=true, yaxis=false, label="",
                       legend=false,
                       aspect_ratio=:equal,
                       alpha=0.5),
             layout=@layout([a{0.5w} b]), size=size2)
        quiver!(:x, :y, quiver=(:x_resp.-:x, :y_mod.-:y), color=GrayA(0.0, 0.3), label="Behavior", subplot=1)
        vline!([cosinesim(baseline_good)], subplot=2)
        vline!([0], subplot=2, color=:black)
        annotate!(cosinesim(baseline_good)*1.2, 1, text("Mean=$(round(cosinesim(baseline_good), 2))", 10, :left),
                  subplot=2)
        title!("Cosine similarity", subplot=2)
    end
Out[30]:
Recall: overall fit
depends on stickiness (low < medium < high) and eagerness to create new clusters
In [31]:
@df(@where(recalled_summaries, :Sσ .≈ 0.01),
    plot(:α, :cos, group=:ρ, xscale=:log10,
         xlims=(10^-2.5, 10^1.5), ylims=(0, 0.115), seriestype=:line,
         xlabel="Eagerness to create new clusters (DP concentration)",
         ylabel=("Cosine sim. with behavior"),
        legend=:bottomright, legend_title="Stickiness", line=2))
Out[31]:
Recall: baselines
consistently ≈ known clusters and > center/mean radius
In [32]:
# @df(@where(recalled_summaries, :Sσ .≈ 0.01),
#     plot(:α, :cos, group=:ρ, xscale=:log10,
#          xlims=(10^-2.5, 10^1.5), ylims=(0, 0.115), seriestype=:line,
#          xlabel="Eagerness to create new clusters (DP concentration)",
#          ylabel=("Cosine sim. with behavior"),
#         legend=:bottomright, legend_title="Stickiness", line=2))

baseline_x = [10^-2.1, 10^1.1]

function plot_baseline!(y, label)
    plot!(baseline_x, ones(2)*y, color=Gray(0.7), label="")
    annotate!(baseline_x[end]*1.05, y, label)
end

plot_baseline!(cosinesim(known_recalled), text("Known\nclusters", 10, RGB(Gray(0.7)), :left, :bottom))

plot_baseline!(bs_center, text("Center", 10, RGB(Gray(0.7)), :left, :bottom))
plot_baseline!(bs_avgrho, text("Mean rad.", 10, RGB(Gray(0.7)), :left, :top))
Out[32]:
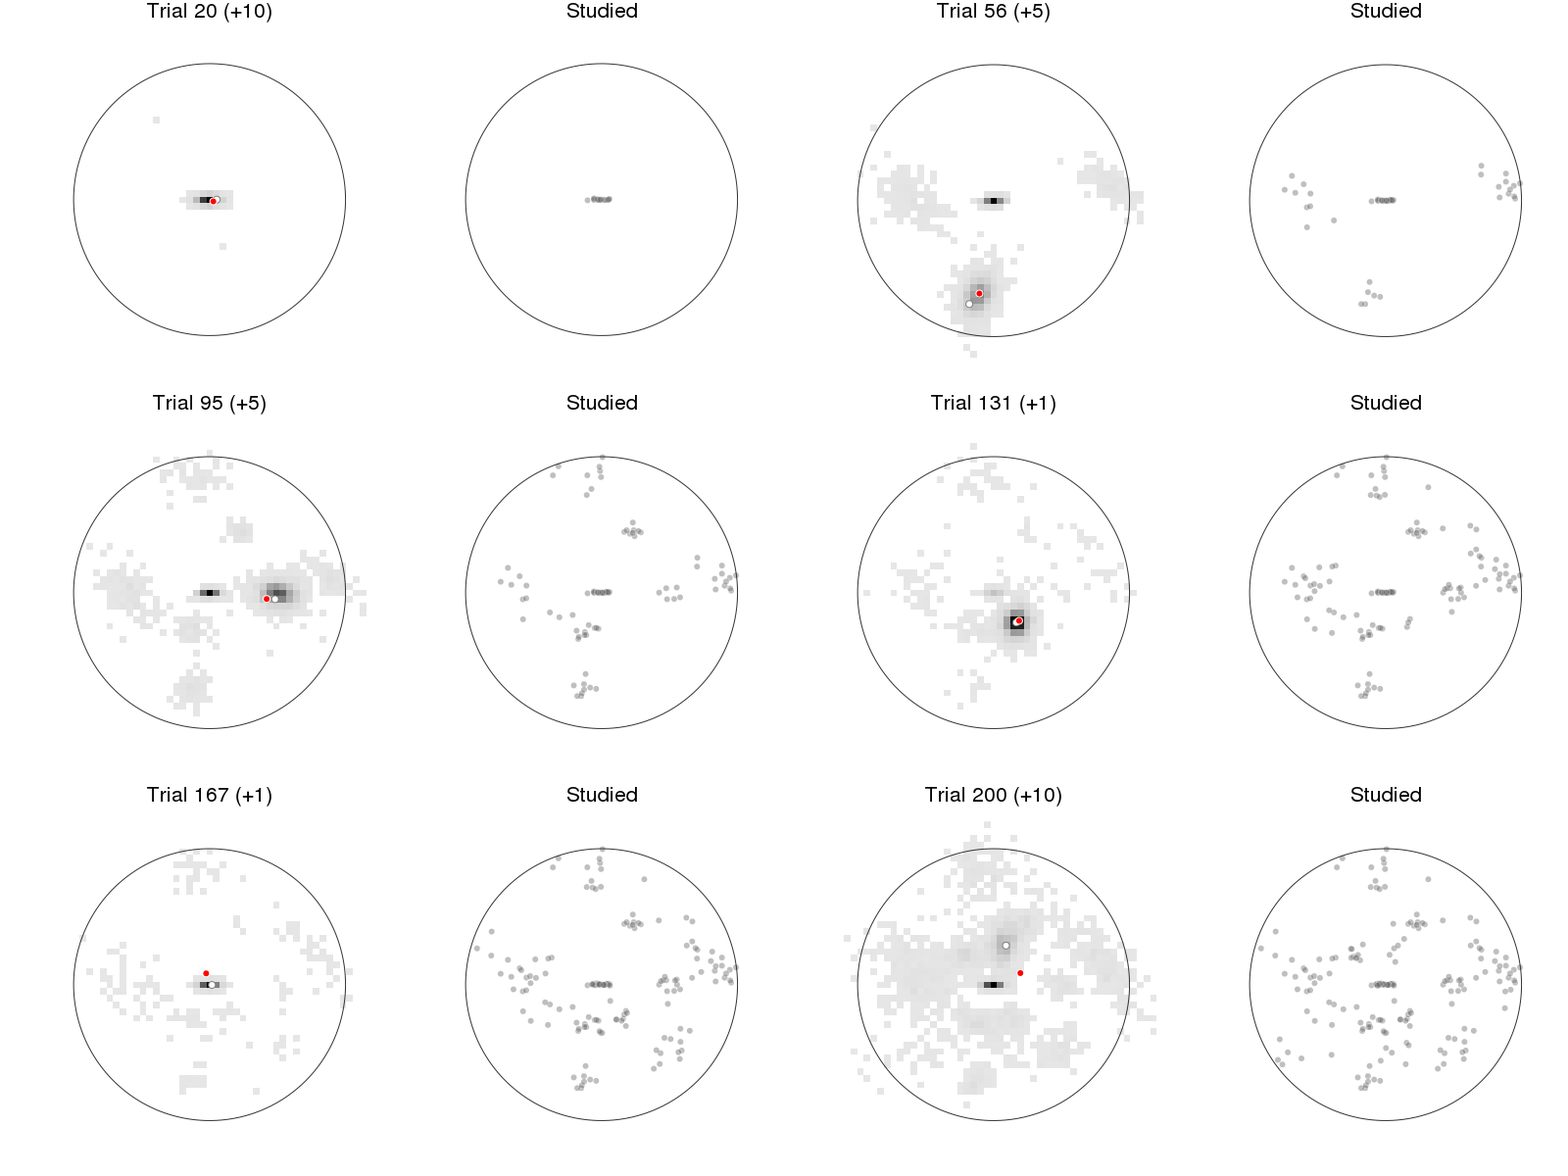
Prediction: model + behavior
In [43]:
let anim = Animation(), rx = recalled1[:x], ry = recalled1[:y], rnr = recalled1[:respnr]
    @byrow! predicted1 begin
        p1 = plot_prediction_task(:xys_mod, :x, :y, :x_resp, :y_resp)
        title!("Trial $(:respnr) (+$(:pred))")
        p2 = arena(rx[rnr.<=:respnr], ry[rnr.<=:respnr], lims=(-1.2, 1.2),
                   markeralpha=0.25, color=Gray(0), title="Studied")
        plot(p1, p2, size=(800, 400))
        frame(anim)
    end
    gif(anim, "figures/pred2.gif", fps=1)
end
INFO: Saved animation to /home/dave/.dropbox-raizadalab/Dropbox (Raizada Lab)/work/dots-location-memory-pernille/figures/pred2.gif
Out[43]:

Prediction: model + behavior
In [40]:
@_ predicted1 |>
    @where(_, :respnr .== 23) |>
    plot_prediction_task(_, title=true, size=(800,400))
WARNING: Keyword argument match_dimensions not supported with Plots.GRBackend(). Choose from: Set(Symbol[:top_margin, :group, :background_color, :yforeground_color_text, :yguidefontcolor, :seriesalpha, :legendfontcolor, :seriescolor, :ztick_direction, :zlims, :overwrite_figure, :xguidefonthalign, :normalize, :linestyle, :xflip, :fillcolor, :ygrid, :background_color_inside, :zguidefonthalign, :bins, :yscale, :xtickfontcolor, :xguide, :fillalpha, :tick_direction, :yguidefontsize, :legendfontfamily, :foreground_color, :xtickfonthalign, :x, :ytickfontrotation, :legend, :discrete_values, :ytick_direction, :xguidefontrotation, :ribbon, :tickfontrotation, :xdiscrete_values, :legendtitle, :xgridstyle, :orientation, :gridstyle, :markersize, :camera, :xforeground_color_grid, :quiver, :zticks, :markerstrokecolor, :ztickfontrotation, :ztickfonthalign, :legendfonthalign, :xtickfontsize, :levels, :zgridstyle, :foreground_color_border, :zguidefontvalign, :marker_z, :markerstrokealpha, :markeralpha, :tickfontvalign, :zguidefontcolor, :ygridlinewidth, :zlink, :zscale, :smooth, :xticks, :zguidefontsize, :y, :margin, :ytickfontcolor, :yforeground_color_border, :zguidefontfamily, :zgridalpha, :yguidefontvalign, :yguidefonthalign, :ztickfontcolor, :html_output_format, :tickfontcolor, :titlefontrotation, :legendfontvalign, :tickfontsize, :z, :yforeground_color_axis, :xtickfontrotation, :xerror, :contour_labels, :xguidefontcolor, :primary, :guidefonthalign, :aspect_ratio, :link, :yguide, :guidefontvalign, :yguidefontfamily, :layout, :polar, :right_margin, :xlink, :series_annotations, :inset_subplots, :ytickfontsize, :tickfontfamily, :xgrid, :ygridalpha, :xtick_direction, :colorbar, :zflip, :ticks, :legendfontrotation, :linealpha, :arrow, :xtickfontvalign, :zgrid, :bar_width, :zguide, :zforeground_color_text, :weights, :xgridalpha, :ygridstyle, :fill_z, :ztickfontfamily, :markershape, :background_color_subplot, :xguidefontvalign, :markerstrokewidth, :xguidefontfamily, :gridlinewidth, :foreground_color_subplot, :xgridlinewidth, :foreground_color_text, :titlefonthalign, :yerror, :zgridlinewidth, :grid, :xguidefontsize, :xforeground_color_axis, :background_color_outside, :titlefontcolor, :line_z, :size, :projection, :zguidefontrotation, :ydiscrete_values, :seriestype, :yflip, :fillrange, :ztickfontvalign, :xlims, :xforeground_color_border, :markercolor, :ylink, :yforeground_color_grid, :color_palette, :lims, :xscale, :left_margin, :annotations, :window_title, :foreground_color_axis, :yguidefontrotation, :guidefontsize, :zdiscrete_values, :tickfonthalign, :bottom_margin, :framestyle, :scale, :zforeground_color_border, :background_color_legend, :linecolor, :foreground_color_legend, :title, :subplot_index, :flip, :titlefontvalign, :foreground_color_grid, :linewidth, :ztickfontsize, :gridalpha, :guidefontfamily, :ylims, :xtickfontfamily, :ytickfontvalign, :ytickfontfamily, :xforeground_color_text, :show, :guidefontrotation, :legendfontsize, :subplot, :label, :ytickfonthalign, :guide, :guidefontcolor, :titlefontsize, :titlefontfamily, :zforeground_color_axis, :zforeground_color_grid, :yticks])
Out[40]:
Prediction: model + behavior
In [41]:
plot_prediction_task(predicted1[end-1:end,:], size=(800, 400))
Out[41]:
Prediction: average distance
model ≈ behavior: distance of predictions at 1 trial < 5 trials < 10 trials
In [44]:
prediction_deviations = @_ predicted_good |>
    @transform(_, resp_dev = rho.(:x.-:x_resp, :y.-:y_resp),
                  mod_dev = mean.(pairwise.(Euclidean(),
                                            transpose.(hcat.(:x, :y)),
                                            transpose.(:xys_mod))))

@_ prediction_deviations |>
    @by(_, [:pred], resp_dev = mean(:resp_dev), mod_dev = mean(:mod_dev)) |>
    @df(_, begin
        scatter(:resp_dev, :mod_dev, markersize=8, xlabel="Response deviation (from last recall)", ylabel="Model predicted",
                group=:pred, legend=:bottomright, aspect_ratio=:equal,
                legend_title="Prediction for next")
        #scatter!(:resp_dev, :mod_dev, markeralpha=0, color=:black, label="", smooth=true)
        end)


plot!(x->x, color=GrayA(0.2, 0.2), label="")
Out[44]:
Prediction: single trial distance
captures variation within prediction horizons
In [45]:
@_ prediction_deviations |>
    @by(_, [:subjid1, :block, :respnr, :pred], resp_dev = mean(:resp_dev), mod_dev = mean(:mod_dev)) |>
    @df(_, scatter(:resp_dev, :mod_dev, xlabel="Response deviation", ylabel="Model predicted",
                   legend_title = "Predictions for next", legend=:bottomright,
                   group=:pred, smooth=true, markerstrokecolor=:white, markeralpha=.3, line=2, aspect_ratio = :equal,
                   size=(800,400)))

plot!(linspace(0,1,100), x->x, color=GrayA(0.2, 0.2), label="")

# @_ prediction_deviations |>
#     @by(_, [:pred], resp_dev = mean(:resp_dev), mod_dev = mean(:mod_dev)) |>
#     @df(_, scatter!(:resp_dev, :mod_dev))
Out[45]:
what have we learned
- people pick up and use structure in recall and prediction
- sequential Bayesian model learns clusters online
- learned clusters captures behavior:
- recall: better than simple baselines
- prediction: distance from last last studied location
what's left
- budget for uncertainty (number of particles)
- online learning of stickiness/clustering/prior on cluster mean/variance
- apply to new data (clearer clusters and no clusters)